Alp is now part of ChampionX. Read more about the news here.
Boost your oil production with Pump Checker®
Unlock the full potential of your oil and gas wells with Pump Checker®. Imagine having all the critical information you need to optimize your production in one intuitive system. No more scattered data or endless spreadsheets.
Just powerful insights and actionable recommendations at your fingertips. You can have the ultimate analytics tool for artificial lift management.

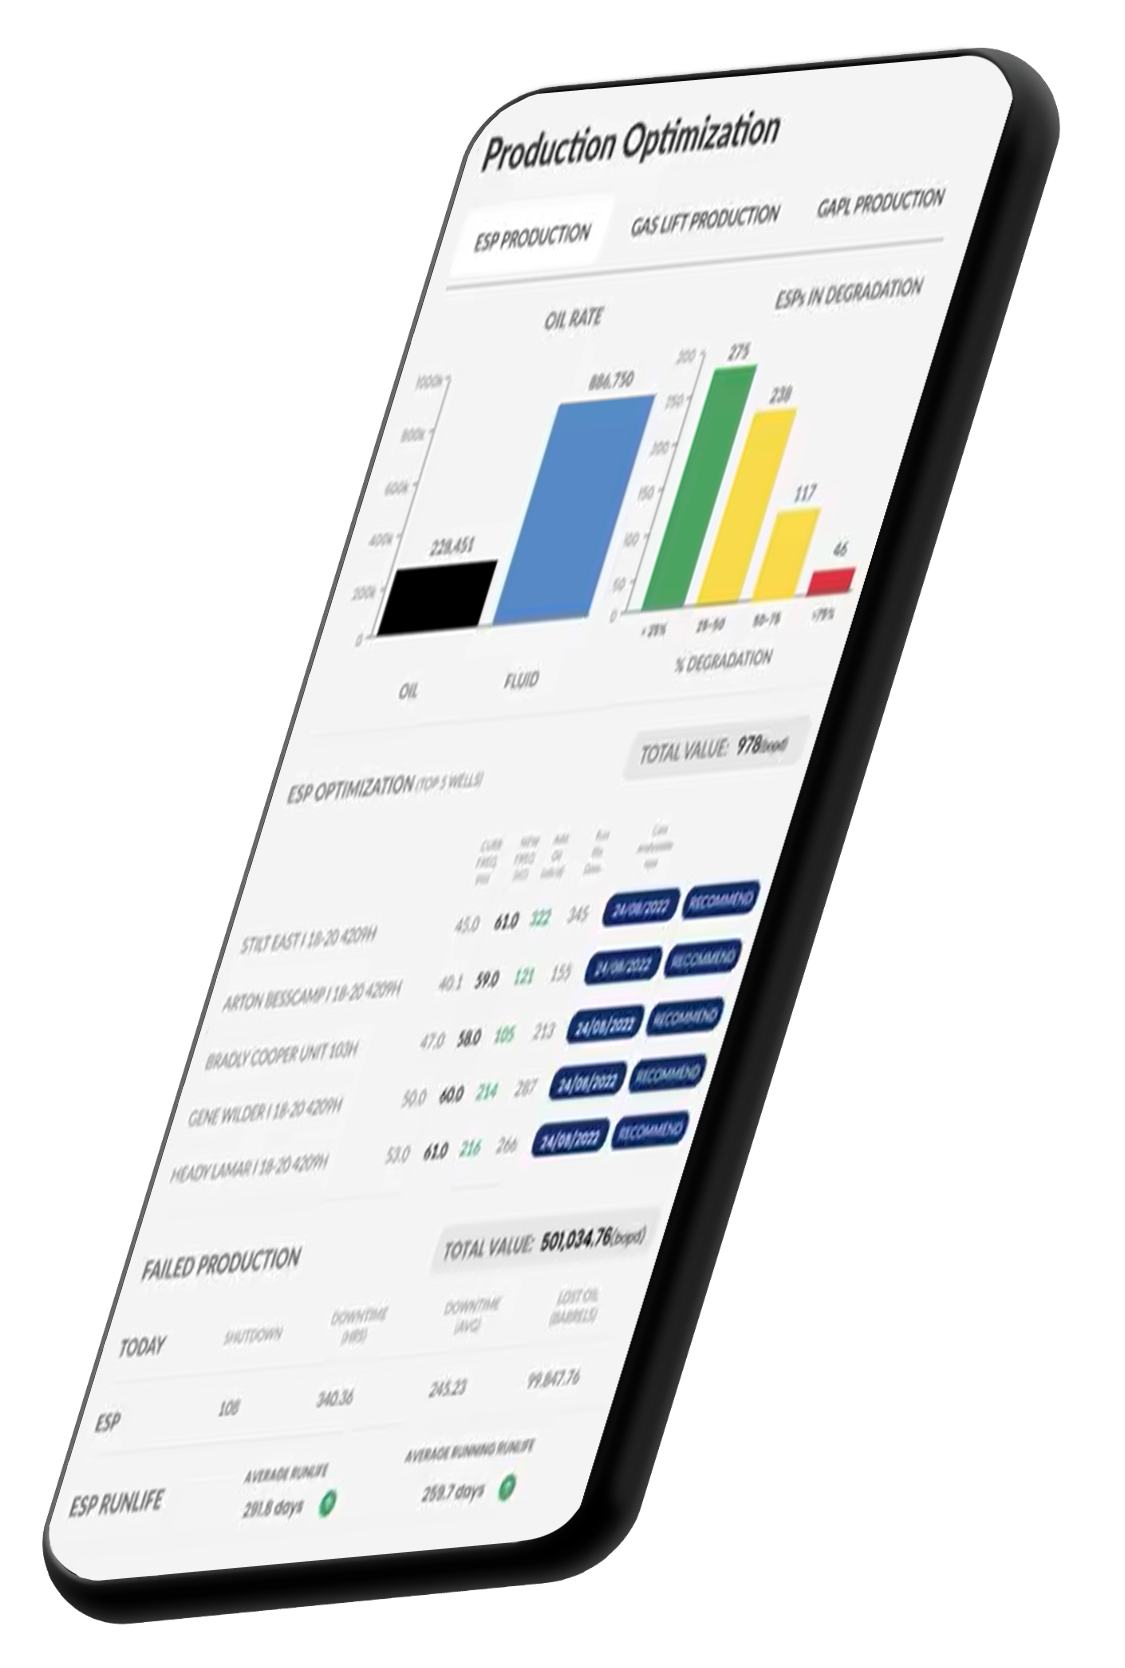
Bringing data and artificial intelligence together, Pump Checker® creates a single view on what is happening and provides recommendations that allow quick decisions and action.
Easily implemented and customizable
Integrate and visualize data from multiple sources
Provide recommendations and monitor results
Hidden revenue growth
Identify issues, seize opportunities. Maximize revenue potential with Pump Checker®.
Data-driven optimization
Unleash potential with Pump Checker’s® analytics. Maximize production, boost revenue.
Optimize efficiency
Manage more wells with the same head count. Keep operations running smoothly. Save engineers time.
Real-time insights
Stay proactive with real-time data. Make informed decisions for success.
Streamlined management
Simplify artificial lift success. All-in-one system for streamlined operations.
Advanced analytics
Unlock data’s power. Drive continuous improvement, stay ahead.
Unlock opportunities for revenue growth
Supercharge your artificial lift performance
Operators invest millions in fracking and completing unconventional wells, but when production falls short of expectations, valuable revenue is lost. That’s where Pump Checker® comes in. Our state-of-the-art software enables you to identify poorly performing artificial lift systems, diagnose issues, and make data-driven decisions to maximize your returns.
Intuitive and comprehensive monitoring
With Pump Checker®, you gain real-time visibility into your artificial lift operating data, production information, ESP diagnosis, and run life tracking. Our high-level dashboards and management-by-exception processes pinpoint problems and opportunities, saving you time and guiding your engineers to focus on the wells with the greatest potential gains.
Diagnose and optimize with ease
Our diagnostics capabilities provide you with a comprehensive view of production increase opportunities. From IPR curves to pump performance analysis, you can dig deep into individual well data to uncover the root causes of underperformance.
Pump Checker® streamlines your troubleshooting process, reduces downtime, and prevents the frustrating up-down cycle that plagues many wells.
Unleash the power of analytics
Analytics is the key to unlocking hidden potential in your oil and gas wells. Pump Checker® offers advanced analytics features, including KPI tracking, install/pull frequency analysis, and failure heat maps for individual components. With this invaluable insight, your team can quickly make informed decisions based on real-time data, ensuring maximum productivity and efficiency.

Join the Pump Checker® revolution
Don’t let your oil and gas production suffer from underperforming artificial lift systems. Take control with Pump Checker® and revolutionize your operations.
Contact us today to learn more about how we can solve the challenges of optimizing production and propel your business to new heights.
